
The words “data analysis” probably don’t evoke much excitement in our high school students, but having the ability to closely examining data sets, graphs, and statistics can be an extremely useful life tool. Throughout our semester together in Microbiology, my students and I have been discovering ways to navigate various types of data. We have looked at various types of data – from abstract line and bar graphs to complex data tables comparing allergic responses between different microbiomes. Understanding that our students will need accommodations to access these materials, My co-teacher and I posed the question: How can we ensure our students with ID will be academically engaged in these lessons?
I have done some reading on effective teaching strategies for students with ID and was able to apply these to data analysis instruction. According to Mark Dombeck, Ph. D., a step-by-step approach to teaching helps learners build up their understanding of bigger concepts. This idea has helped my students grapple with data set and graph analysis. .
“One such strategy is to break down learning tasks into small steps. Each learning task is introduced, one step at a time. This avoids overwhelming the student. Once the student has mastered one step, the next step is introduced. This is a progressive, step-wise, learning approach. It is characteristic of many learning models. The only difference is the number and size of the sequential steps.”
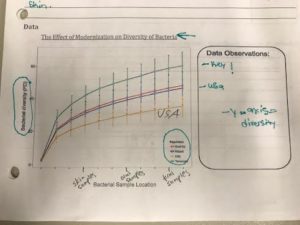
What may like a daunting task to students with ID, data analysis can be authentic and inclusive when its components are broken down into micro-steps.. A group of four students and I started exploring a somewhat complicated line graph that plotted “The Effect of Modernization on Diversity of Bacteria”.
- Our first step was to simply locate the graph’s title, x and y axes, and then make meaning from these observations.
- From there, we made meaning of the graph by asking each other questions: What does the green line represent? Which direction is the line moving from left to right? What does this increase mean?
- Next, we dove deeper in to data by comparing the graphs different groups and, ultimately, were able to understand the relationship between modernization and the diversity of bacteria on our skin, mouth, and in feces.
This level of scaffolding was not necessary for our other students but were tremendously helpful to severely disabled students.
 Breaking down the process of data analysis (and undoubtedly countless other academic activities) allows the task to be approachable and authentic students with severe learning disabilities. Over the following weeks, I reinforced the step-by-step process using other data sets and was able to witness students’ skills and independence with the task develop. Utilizing evidence-based strategies for these students has ultimately helped them build an entire new skill set.
LOVE LOVE LOVE!!! Coming from a math teacher where literacy with data is essential, I love that you have found ways to support ALL students when reading data. My only suggestion for the scaffolded steps that you created would be to have students start thinking about what the data/trend would look like before you give them the data. For example, before they look at a graph of how bacteria develops over time, have them discuss what they think it will look like. Have them do a draft scatter plot or discuss what the shape will look like. I’m not sure if this fits into the tasks that you gave them, but I did this during Stat’s panels. Give them the situation, and let them identify what they think the graph would look like. Great Blog Post!!!!